


This weeks blog is by the NERI economist Ciarán Nugent. The evidence suggests that inequality in Irish wages between the bottom (the 10th percentile) and the top (the 90th percentile) is higher than in any other high-income European country by some margin.
The worker at the 90th percentile earned almost 4 times the worker at the 10th (3.98). This compares to 3.53 in the UK and 3.49 in Germany (the next two most unequal labour markets), both of which have closed this gap significantly since 2006. Ireland’s gap between the top and the bottom is almost twice that of Sweden (2.09).
The Structure of Earnings Survey is a large-scale enterprise sample survey conducted every four years. New data on the structure of earnings in the EU in 2018 was published in late 2020 for enterprises with 10 or more employees. In an Irish context, the survey covers just under 1.6 million of approximately 1.9 million employees (in 2018).
The latest NERI report analyses four rounds of the survey (2006-2018) and compares the hourly earnings structure in Ireland relative to high-income EU countries (real GDP per capita above €25,000), as well as the UK. Luxembourg is excluded.
The report relies on the data directly available through the Eurostat website. It includes average hourly earnings (or the mean) as well as indicators describing the relationship between earners at three points in the distribution; the bottom (p10), the middle (p50 or the median) and the top (p90). A breakdown by various characteristics is also available (by gender, age group, part-time/full-time, by broad occupation, by broad sector etc.)
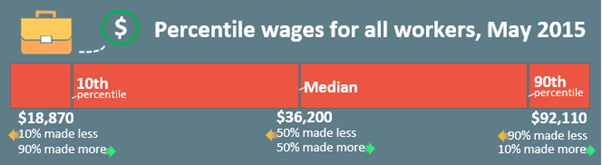
The p10 (10th percentile) is the point at which 90 percent of employees earn more and 10 percent earn less (see graphic above from the Bureau of Labour Statistics in the US). The opposite is true for the p90 variable which demarcates the threshold of the top 10 percent of earners. The median is the middle mark in the distribution or the 50th percentile. Half of workers earn more and half earn less than the median (p50). The p10 and the p90 rates are what is available through Eurostat in the Structure of Earnings Survey and I will at times refer to them as the ‘bottom’ and the ‘top’. However, it’s important to note the wide gap that also exists between p90 and p99 (or the top 1 percent) and also between p10 and p1 (the bottom 1 percent). For instance, estimates for 2018 on earnings distribution (weekly) in the Earnings using Administrative Data Sources survey (EADS) showed the gap between p90 (the top) and p99 (the very top) to be almost identical as the gap between the median (p50) and p90 in relative terms (approximately 2.5 times for each).
The evidence suggests that inequality in Irish wages between the bottom (the 10th percentile) and the top (the 90th percentile) is higher than in any other high-income European country by some margin. Hourly earnings in Ireland within occupational groups tend to be relatively high on average and for those at the top (among high-income EU countries), but mid-ranking for earners in the middle and at the bottom of the distribution.

The Structure of Earnings Survey also estimates the purchasing power of these hourly rates in their prospective economies related to the cost of living. Comparing hourly earnings by Purchasing Power Standard (PPS), Irish earners in the middle and at the bottom do not fare as well as most of their European peer-group. Earners at the top in Ireland however, can afford more goods and services with compensation for an hour’s work than any of their equivalents in 10 other high-income countries, while Irish earners at the bottom can buy the least relative to their peers in Europe. This is a stark finding of the level of inequality in the Irish labour market.

Ninety percent of Irish employees were on less than €41.29 an hour (p90) in 2018, 10 percent earned less than €10.23 (p10) and half less than €17.79 (the median or p50). The average hourly rate at €22.88 is significantly higher than both Eurozone and EU averages (€16.90 and €16.09), the second highest in the sample of affluent EU countries but significantly behind Denmark (€29.53). The Irish worker at the 90th percentile (the top) also earns the second highest hourly rate, but it’s much closer to the Danish equivalent (€43.24). For hourly earnings at the median (the middle point) and at the 10th percentile (the bottom), the Irish ranking is closer to mid-table (4th and 5th) of 11 high-income EU countries.
The worker at the 90th percentile earned almost 4 times the worker at the 10th (3.98). This compares to 3.53 in the UK and 3.49 in Germany (the next two most unequal labour markets), both of which have closed this gap significantly since 2006. Ireland’s gap between the top and the bottom is almost twice that of Sweden (2.09).
The distance between the bottom and the top in Ireland is more similar to the distance between the top and the bottom in the entire Eurozone (4.23; 2014) than the next most unequal country, the UK (3.53). Considering the fact that the Eurozone covers 19 labour markets from the relatively low-income Baltic states to high-income states like Germany, Belgium and Luxembourg, this is a revealing statistic about the exceptional level of inequality in the Irish labour market in a European context.
This relationship holds when looking specifically at full-time employees. Similarly, Ireland has relatively high earnings inequality in the Business economy (a proxy for the private sector) out of the 11-country sample (2nd behind the Netherlands). The gap between the top and bottom in the Business economy has remained relatively static since 2006, though it has narrowed in some countries in this period (Germany and the UK for example).
The ratio of hourly earnings between the median (50th percentile) and the top (90th percentile) is also highest in Ireland and was wider in 2018 than in 2006. The difference between the bottom (10th percentile) and the median/middle (50th percentile) is also relatively high in a European context (3rd out of 11), though this has narrowed moderately since 2006.
Irish earnings inequality is also in the top 3 rankings in 8 out of 9 occupational categories, with earnings among Skilled Agricultural, Forestry and Fishery workers the only exception.
The evidence suggests that high wages in the Professions are one significant factor in explaining the level of inequality in Irish wages. Irish Professionals at the top of the earning scale (p90) earn more per hour than their equivalents in any EU country. The gap between the top and the bottom is significantly ahead of the rest of the pack (3.62). The group includes Doctors, Finance workers, Accountants, Software Developers, Economists and Journalists as well as some of the so-called ‘sheltered professions’ (Legal, Pharmacy and Medical Services).

Perhaps as significant, at least more recently, is the widening gap between hourly earnings of younger workers and the rest. The ratio of average hourly earnings for under 30’s to average earnings is second lowest in Ireland in a high-income European context and the lowest when controlled for full-time workers. Since 2006, this gap has widened more in Ireland than any other of 11 high-income EU countries. In 2006, the average Irish full-time worker under 30 earned 72 percent of the average. In 2018, it was 65 percent.

This increase in intergenerational inequality in Ireland applies across every occupational group (9) including those associated with most training/education and wages.
Though the share of younger workers with tertiary education has continued to grow, returns to that education in the form of hourly earnings since the financial crisis are not in line with what economic theory would predict. Ireland has a relatively high share of workers in low pay (up to 2/3’s of the median), of young workers in low pay and is an outright outlier in the share of tertiary graduates working in jobs with low pay (13.0 percent). Estonia is the only other country in double digits out of 30 in the entire sample and the share of Irish workers with high levels of education in low wage jobs is 8-9 times the rate in Finland and Sweden (1.5 percent).

The evidence suggests that the effects of austerity and the explicit strategy of wage suppression (internal devaluation) post-financial crisis of both Fianna Fail/Green and Fine Gael/Labour governments disproportionately imposed on younger generations has been an important driver/accelerator of high earnings inequality in Ireland.
The recent EU Directive on Minimum Wages makes a strong connection between low pay and collective bargaining coverage. Only 33 percent of Irish employees are covered by a collective agreement compared to 99 percent in France and 90 percent in Sweden. Research from the IMF finds that less prevalent trade union presence and collective bargaining are associated with higher market inequality, while others find that higher levels of collective bargaining are associated with lower levels of inequality for OECD member states. Evidence also suggests that wage compression in Sweden resulted in positive aggregate productivity gains.
The state should also increase the minimum wage of €10.20 to the Living Wage of €12.30.