

One year on from the start of the Covid-19 pandemic: What can be said about our labour market?
We take a look over the year at the labour market, highlighting the good, the bad and the ugly.
The start of 2021 brought with it a surging third wave of Covid-19 and as we know, this resurgence of the virus did not just bring with it, the by now familiar, challenges for our health service but also another wave of impacts for our economy and our labour market. This is because going into lockdown reduces economic activity and hours worked, particularly in sectors forced to shut.
Now, however, as the rollout of the vaccine has been picking up speed and as confidence grows that this will be our last re-emergence from lockdown it is worthwhile taking stock of where the labour market is and how it has fared to-date through the crisis. This blog takes a look through the good, the bad and the ugly of the labour market impacts over the past year.
The good - Jobs
Starting with jobs. We can get a picture of how the various lockdowns over the year has been impacting upon jobs from two key sources. The first is provided by HMRC’s PAYE employment data which gives us a more timely and up-to-date count of employee jobs, than that provided by our second data source - the Labour Force Survey. The labour force survey is typically published with a two-to-three-month lag. In this respect, whilst there is pros and cons to both data sources, the HMRC PAYE employment data is extremely valuable in its timeliness.
Looking at the HMRC PAYE employment data in the graph below we can see that with the exception of the sharp fall-out of jobs in the initial stages of the first lockdown we have seen a steady picture in terms of the number of paid employees over the course of the year, and indeed a visible uptick in the number of jobs through December which continued into January. By January 2021 there was around 745,000 paid employees, compared to around 753,000 jobs in February 2020.
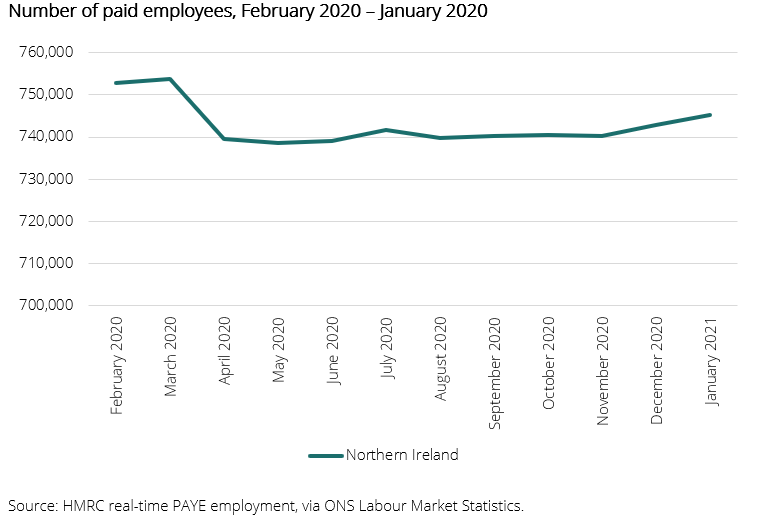
All in all, whilst there has been a decline over the year in the number of employee jobs the scale of deterioration is nowhere to the scale as what some were predicting this time last year and indeed the improving of the trend in the eve of the most recent lockdown is promising and suggests that we have reason to be optimistic that when the sectors of the economy which have been forced shut are allowed to reopen that we will see a continuation in the rebound in employment.
That being said, we also know that the steadiness in the number of jobs is the result of the impact of Governmental policy, and in particular, the Coronavirus Job Retention scheme.
Do not rely on the unemployment rate
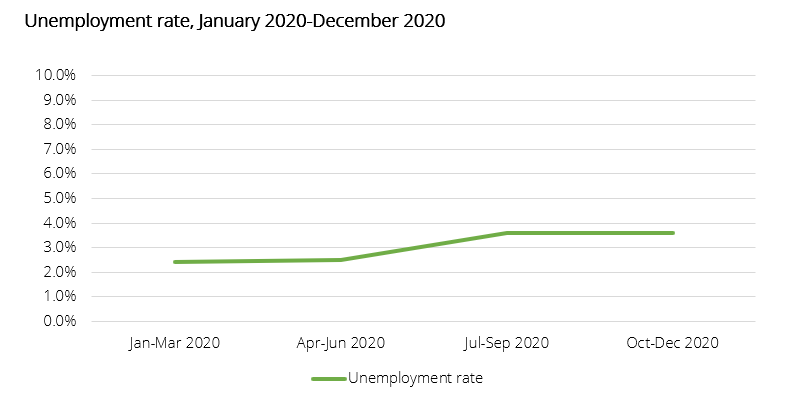
Usually when there is a crisis in our economy or in our labour market economists’ race to have a look at what is going on with the unemployment rate data to get to grips with the scale of the problem. But in this crisis, as can be seen from the graph below the unemployment data is not a useful indicator and has been inadequate in characterising the effect of the pandemic on the labour market.
The unemployment rate has risen only very modestly since the onset of the COVID-19 pandemic increasing from 2.5% in January-March 2020 to 3.6% by October-December 2020. It is however, noteworthy from the graph below that much of this increase occurred during the Summer period, despite much of the economy having reopened in that period.
As we emerge out of lockdown, into the recovery period and as supports are drawn away the unemployment rate will become increasingly important to track again.
The Coronavirus job retention scheme
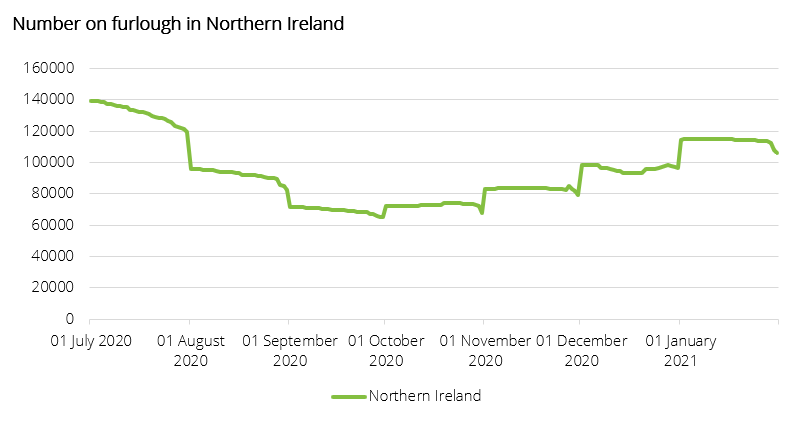
By the end of January 2021 1 in 7 paid jobs were being protected by the Coronavirus Job Retention Scheme. The visible furlough stairs in the graph below shows that as the economy was reopened through last Summer, the numbers on furlough began to have a staged drop. In contrast, through the Winter when lockdown restrictions were increasingly introduced that the numbers on furlough climbed again.
Until now, the Coronavirus Job Retention Scheme has allowed us to avoid a situation of mass unemployment through monumentally delivering on its purpose of protecting jobs. The exception to this trend of supremacy in protecting jobs came in the Autumn with the rise in redundancies as employers expected the scheme to be withdrawn.
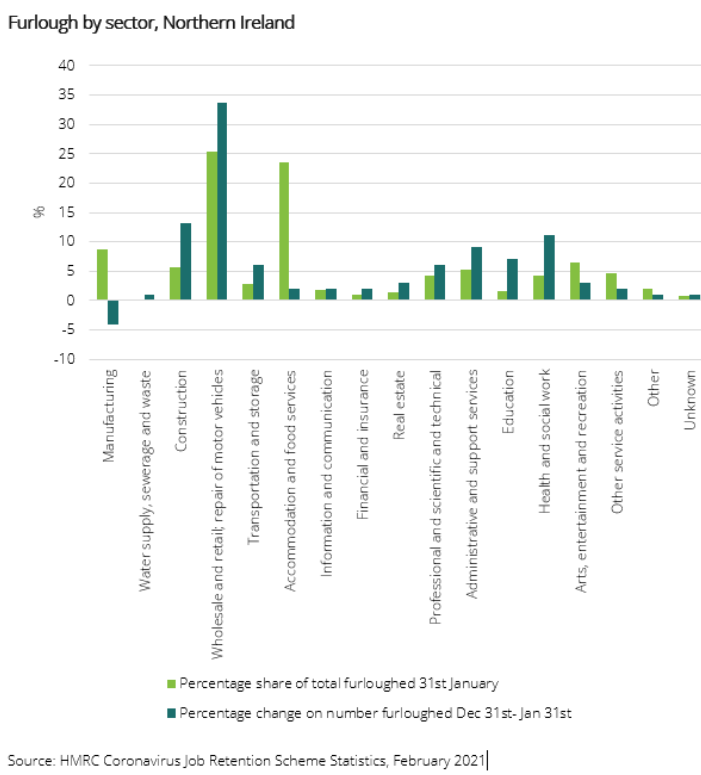
The sector that people work in has played in a key role in determining the effect of the pandemic on their employment. The Coronavirus Job Retention Scheme has been detrimental to supporting employments in those sectors hardest hit by lockdown restrictions.
The bad - Redundancies & the claimant count
A closer look at some labour market data shows that despite the apparent stability that data on job numbers, employment and unemployment would lead us to believe is there, the terrain is relatively malleable. Some notable points of weakness remind us that the labour market is under pressure.
Redundancies
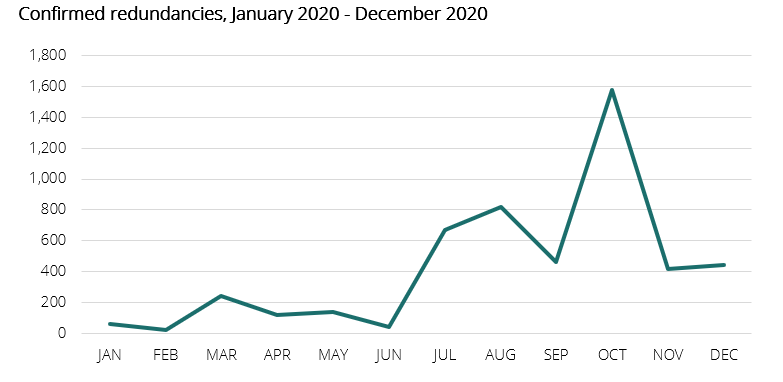
A key marker of a worsening labour market is redundancies which have been trending upwards since the start of the pandemic. As shown in the graph below the level and timing of the sharp rise in redundancies through late Summer and into the Autumn driven in part by the Government’s late extension of the Coronavirus Job Retention Scheme - the extension to the scheme was only announced a few weeks before it had been expected to close.
Over the last twelve-month period, 10,640 redundancies were proposed. At 5,150 the number of confirmed redundancies in the last year is much lower and in part reflects the advanced notification period between proposed and confirmed redundancies. Around 40% of the redundancy notifications took place in June and July while nearly 90% of redundancies confirmed in the last year were in the seven months since July.
Over the latest twelve-month period there were 5,150 confirmed redundancies, which was 69% higher than the previous year (3,050) and the highest annual total recorded since 2004. Of these, 1,960 (or 38%) were confirmed in ‘Manufacturing’. 1,100 (21% of all confirmed redundancies) in the ‘Wholesale and retail trade’ and a further 500 (10% of all confirmed redundancies) in the ‘Transportation and storage’ sector.
The Claimant count
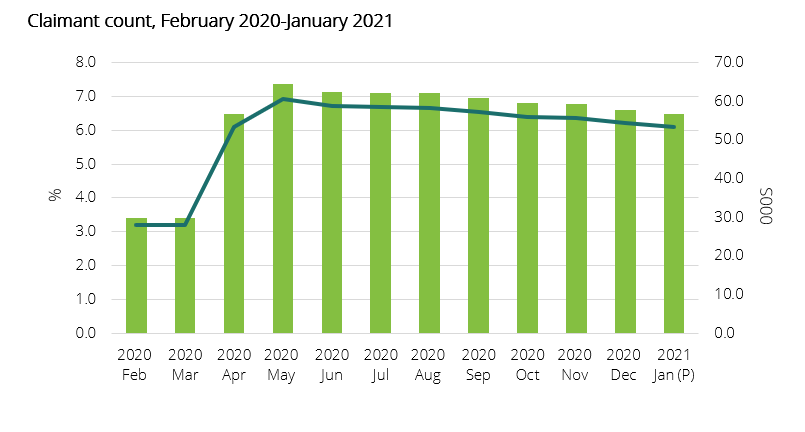
Looking over the year of Claimant count data also shows that all is not rosy in the labour market. That being said, as is clear from the chart below much of the increase in the claimant count occurred in the initial months of the pandemic and during the first lockdown and indeed we have seen a small, albeit continuous decline in the claimant count in the months since. Increases in claimant count can largely be attributed to the increase in the numbers of people becoming unemployed or having their hours reduced, resulting in very low earnings below the administrative earnings threshold. The NI seasonally adjusted claimant count stood at 56,700 in January 2021, representing an increase of 26,900 since March 2020 or in percentage terms an increase of 91.4% over the year.
The ugly - Economic inactivity
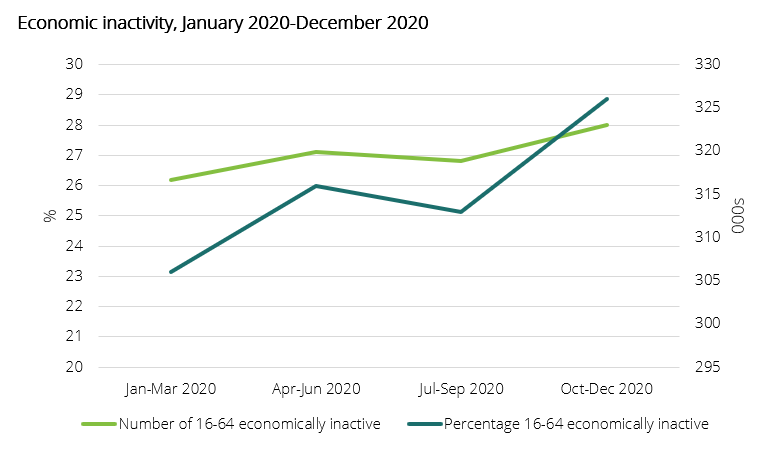
Perhaps most worrying of all the labour market indicators, given that this issue has long been a thorn on the side of Northern Ireland’s labour market performance is that our rate of economic inactivity has been growing fairly consistently over the year and was close to 2 percentage points higher in October to December 2020 than it was in the first quarter of 2020.